Excel Tips & Tricks
This article shows practical Excel features you can use with the Settlement report. Similar features exist in other spreadsheet tools, such as Google Sheets. Read Understand the Settlement report for an explanation of the report itself.
Find something quickly in the file
If you want to locate a specific value, use Find:
- Ctrl+F on Windows
- ⌘+F (Cmd+F) on Mac
Useful things to search for include:
- A payout reference from your bank statement
- A customer name
- An amount
- A message
Filter by column
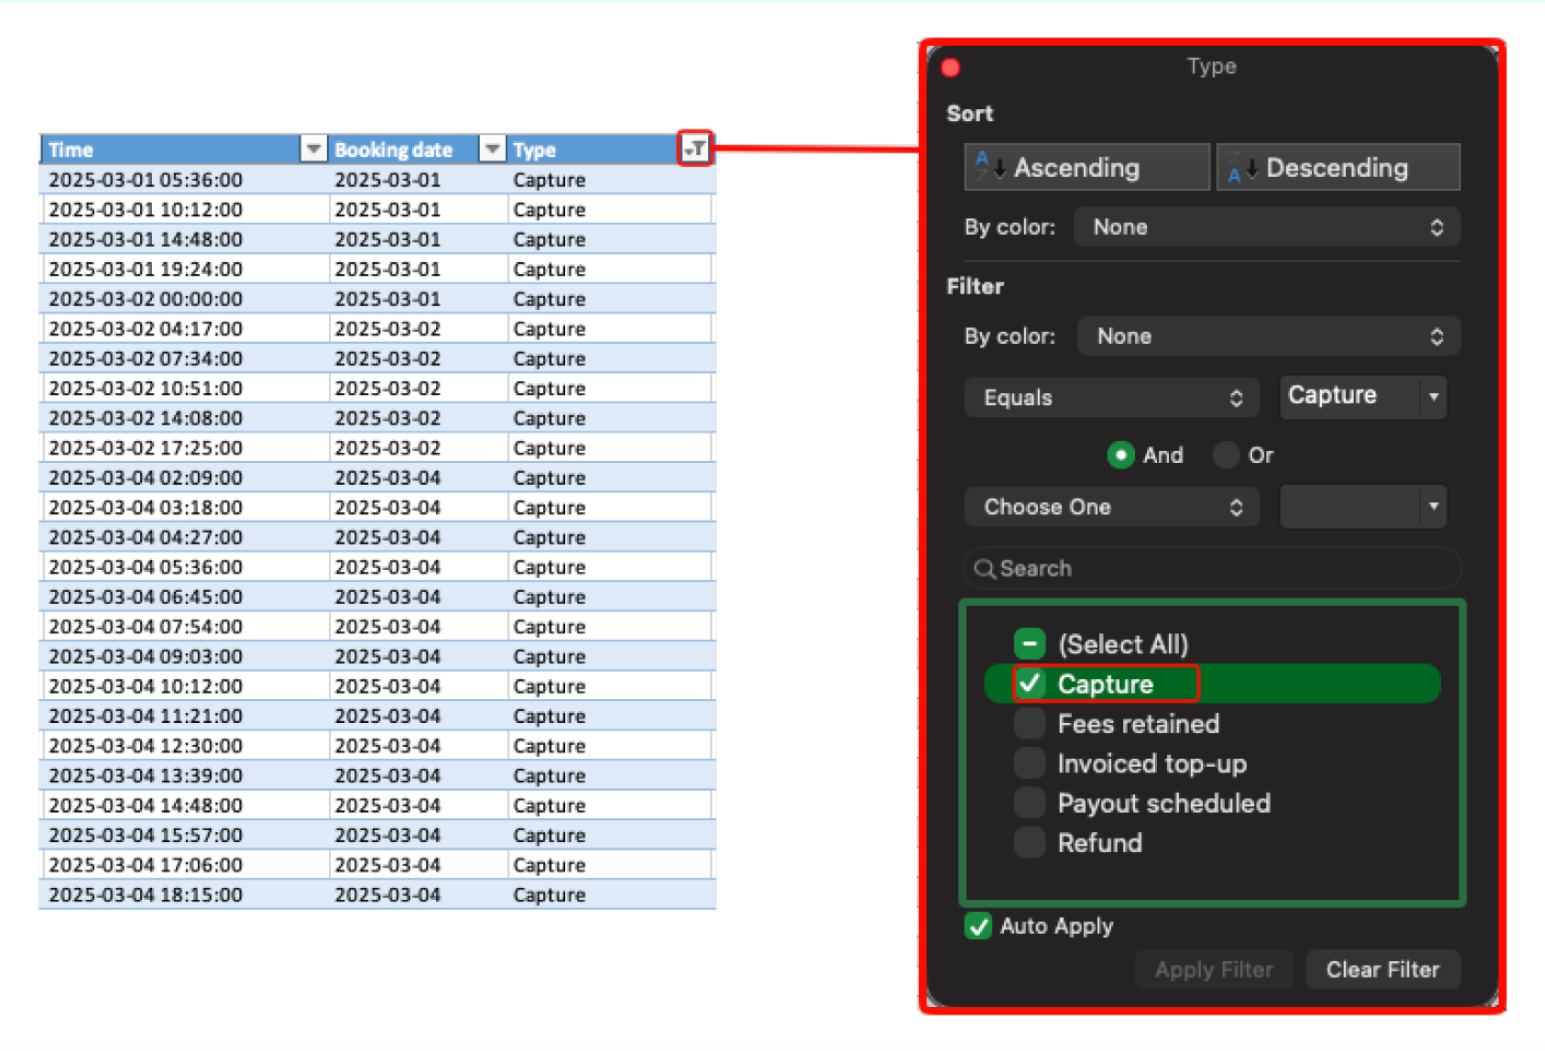
Filtering is one of the most useful ways to work with the Settlement report. All columns can be filtered, indicated by the small arrow in each column's header. Click on the arrow to start filtering. Filtering doesn't delete anything, it only hides the rows you don't want to see right now. This is useful when you want to:
- Only show one Type, such as Capture, Refund, or Payout scheduled
- Only show one Sales unit
- Only show a smaller Booking date range
Sort by column
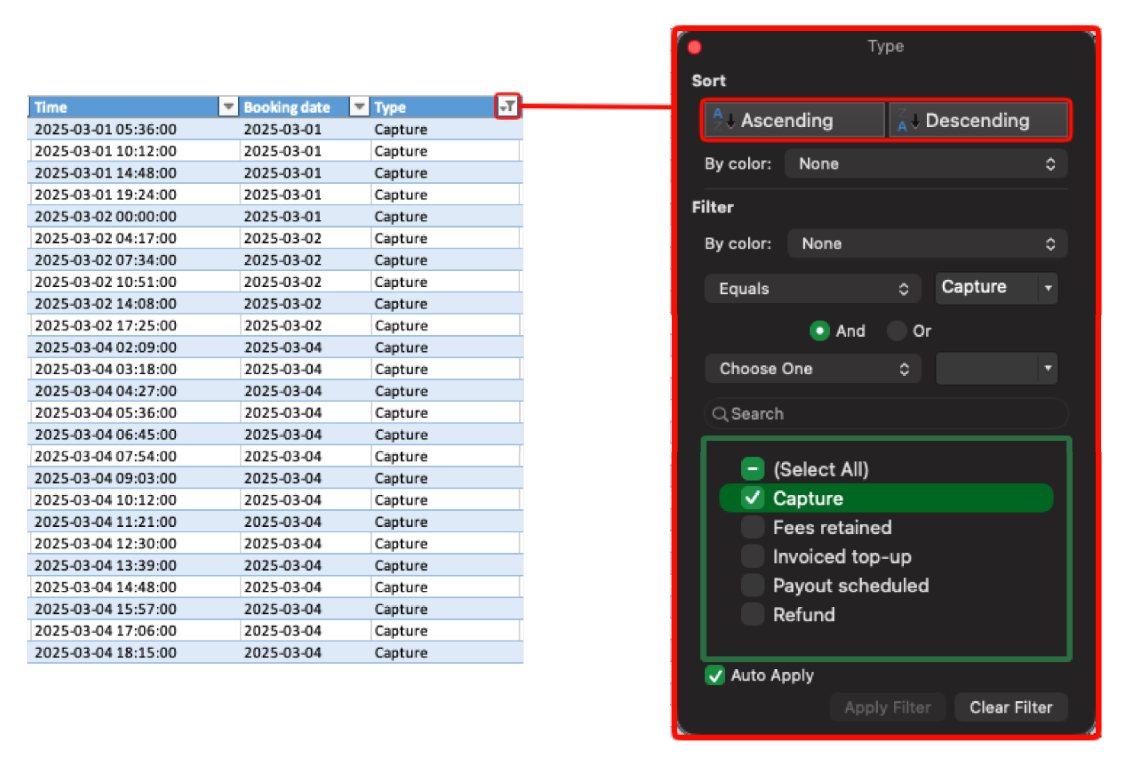
Sorting changes the order of the rows, so similar values appear together. This can help when you want to:
- See the largest or smallest Amount first
- Order payments by customer name
To sort, click the small arrow by the column name, and then Ascending or Descending.
Sum values quickly
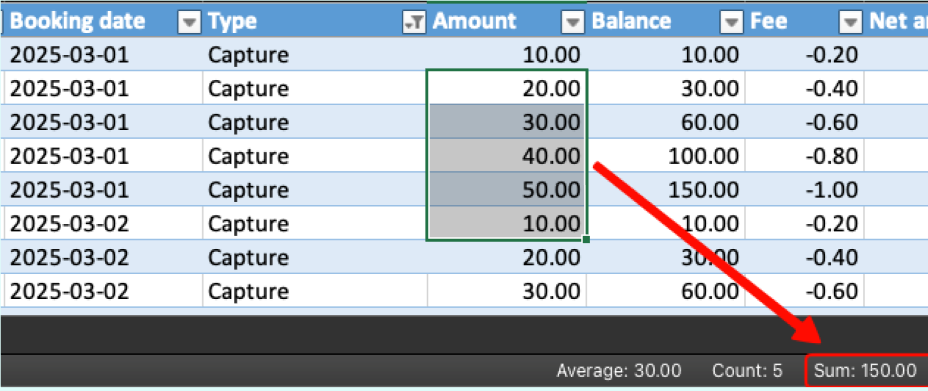
If you click and drag to select multiple cells, Excel shows you useful values such as the sum, count, and average of the selected cells in the bottom-right corner of the window. This is the fastest way to quickly calculate sums. This is a good trick to pair with filtering. For example, if you filter by Type to only show Capture rows, you can select the visible cells in Amount and quickly check the total amount of captures. If you don't see these values, right-click on the bottom bar in your Excel window, and make sure "Sum" is checked. Here you can also enable or disable other quick stats, such as "Count", "Average", "Minimum" and "Maximum".
Select all cells in a column
Click the letter at the top of the column (for instance, H) to select all cells in that column. Pair this trick with Filtering and Quick sums for an efficient workflow.
Hide columns you don't need
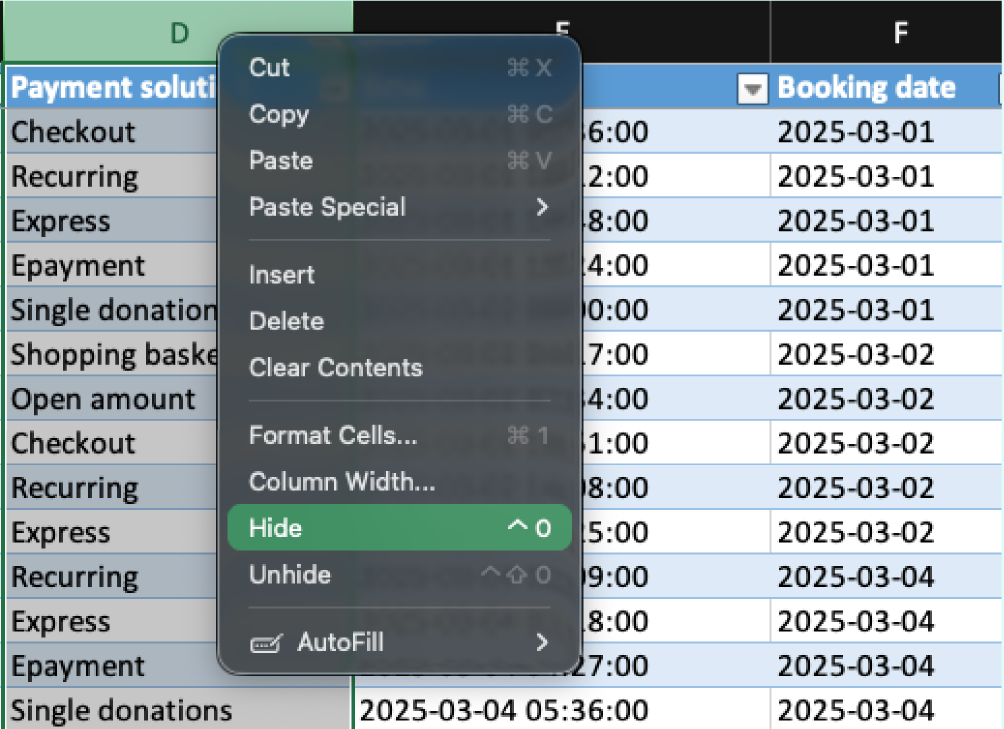
If you only need part of the report, you can hide the columns that are not useful for your task. Right-click the letter at the top of the column (for instance, D) and click Hide. This is especially helpful before you:
- Share the file with someone else
- Print it
- Save it as PDF
Note that hiding a column doesn't remove it from the file – anyone can un-hide the column later.
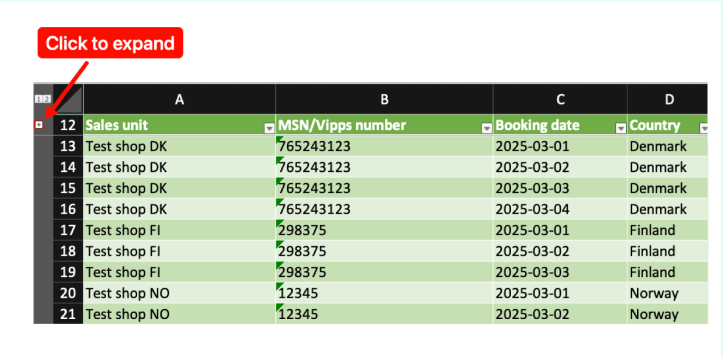
Collapse the Summary preamble
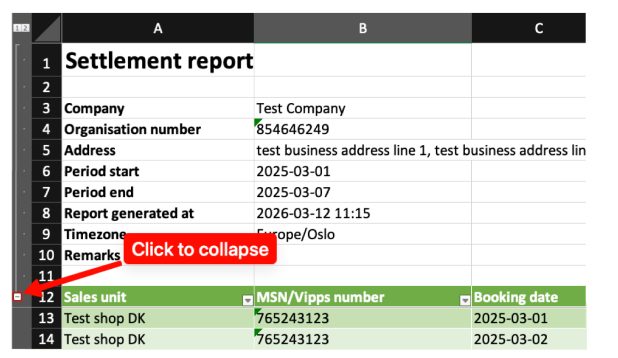
In the Summary sheet, the first rows contain report information such as company name, organisation number, period, and timezone. These rows are grouped, so you can collapse them when you do not need them on screen. To the left of the row numbers, click:
- - to collapse the preamble
- + to expand it again
Create a pivot table
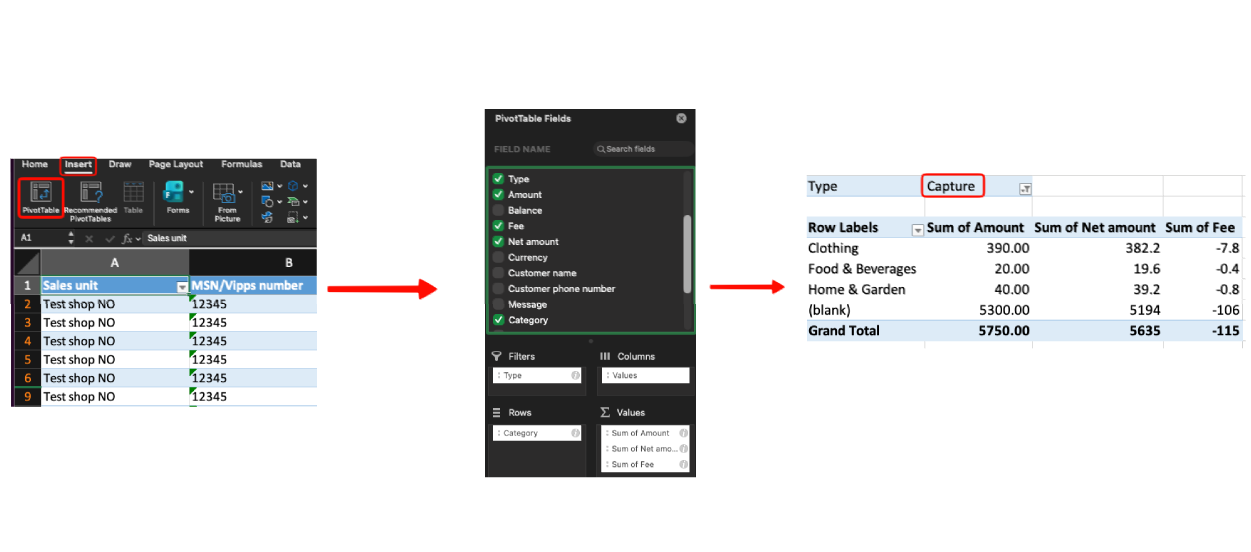
A pivot table helps you turn a long list of rows into a simple summary, for instance to answer questions like:
- How much did we sell per Category?
- What are the totals per Sales unit?
- What happened on each Booking date?
- What is the total Amount or Net amount for each Type?
Note that some of these questions are already answered in the Summary sheet. If pivot tables are new to you, start simple:
- Open the Details sheet
- Click Insert -> Tables → Pivot Table -> OK
- Find the field Type and drag it into the Rows area
- Find the field Amount and drag it into the Values area
Now you see the total Amount for each Type. Then experiment further:
- Drag Booking date into the Rows area
- Drag Type below Booking date and see how the table changes
- Move Type into the Columns area instead and see how the table changes
- Swap Amount for Net amount if that's the number you care about
- Move Type into the Filters area. Then click the little arrow on row 1 and choose Capture to only include capture amounts in the table, excluding amounts from Refund, Fees retained, Payout scheduled etc. type entries.
A good setup for summing by Category:
- Filters: Type, and select Capture in the filter
- Rows: Category
- Values: Amount and Net amount
To extend this, you can optionally add Booking date to see the sales per day, and Sales unit if you have several sales units.
Automate repeated steps
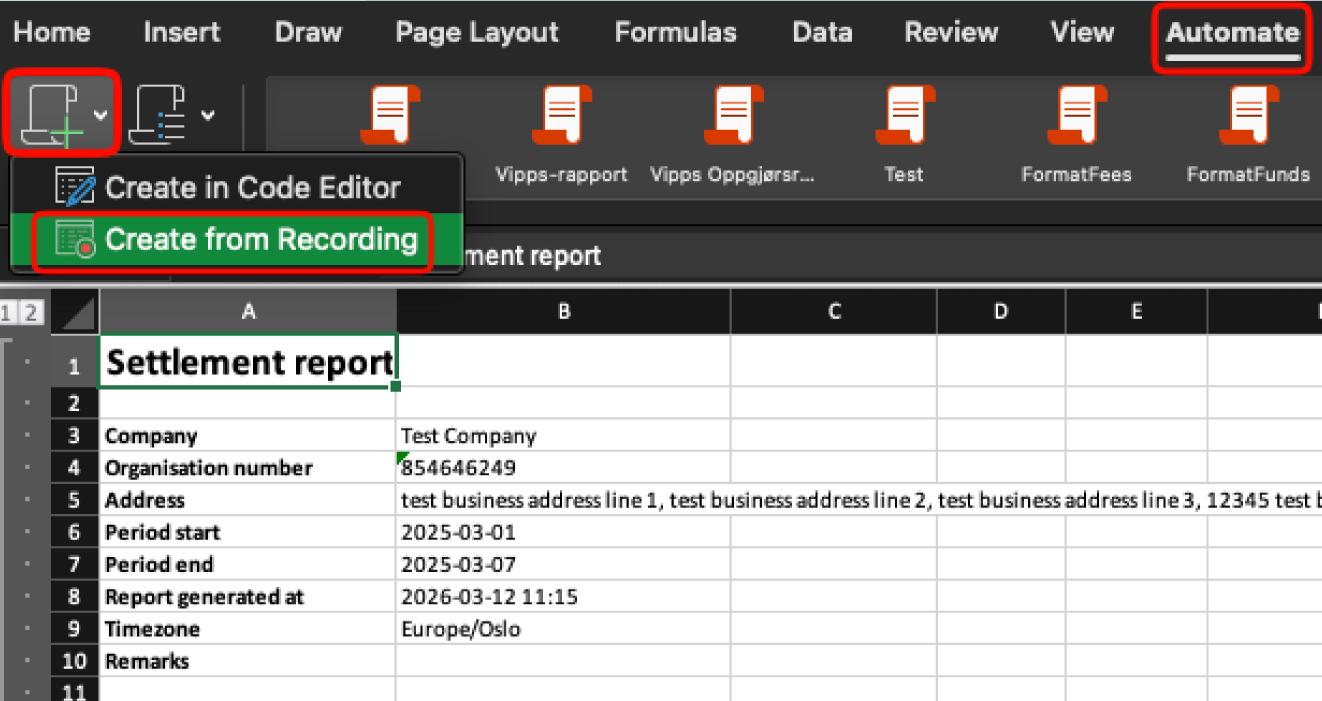
If you often do the same clean-up steps every time you open the report, you can automate them easily in Excel. This creates a "recording" of the steps and allows you to "replay" them later – thus you can perform all your desired clean-up steps in one second instead of several minutes. This is useful if you regularly:
- Prepare a version for printing
- Prepare a version for an accountant
- Apply the same filters every time
- Hide or delete the same columns every time
To create a new automation:
- Click Automate
- Click New Script
- Click Create from Recording
- Wait for the automation sidebar to appear on the right
- Perform all the actions you want to automate
- Click Stop in the automation sidebar.
- Give the script a name, for example "Simplify settlement report"
Now, when you open a new Settlement report file, click Automate, and the automation script you recorded will be available. Click it to run all the recorded steps on the new file.